


Introduction to Tracking Learners Progress in Courses
Tracking learner progress is essential for understanding how participants engage with your courses, identifying where they may need additional support, and measuring overall program effectiveness. The Courses Dashboard gives you detailed insights per cohort across enrollment, completion, unit performance, quiz results, and evaluation status.
Where to Find the Courses Dashboard
Navigate to Courses in the top menu, select Courses Management from the left sidebar, and click the Dashboard button on the course you want to review.
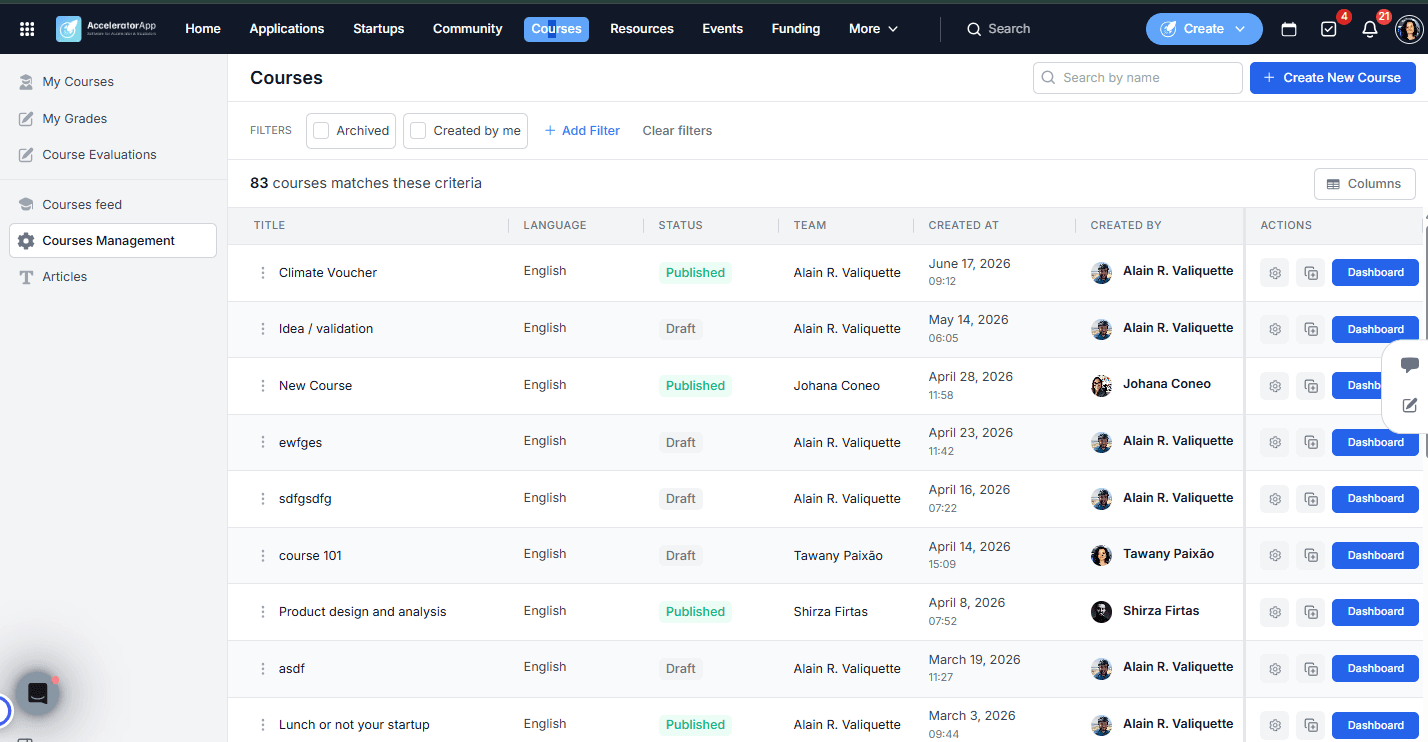
Step-by-Step
1. Select a Cohort
After clicking Dashboard, you will see a list of all published cohorts for that course. Click on a cohort name to open its detailed progress view.
2. Navigate the Dashboard Tabs
Inside the cohort view, you will find four tabs on the left. All tabs include an Export button to download the data.
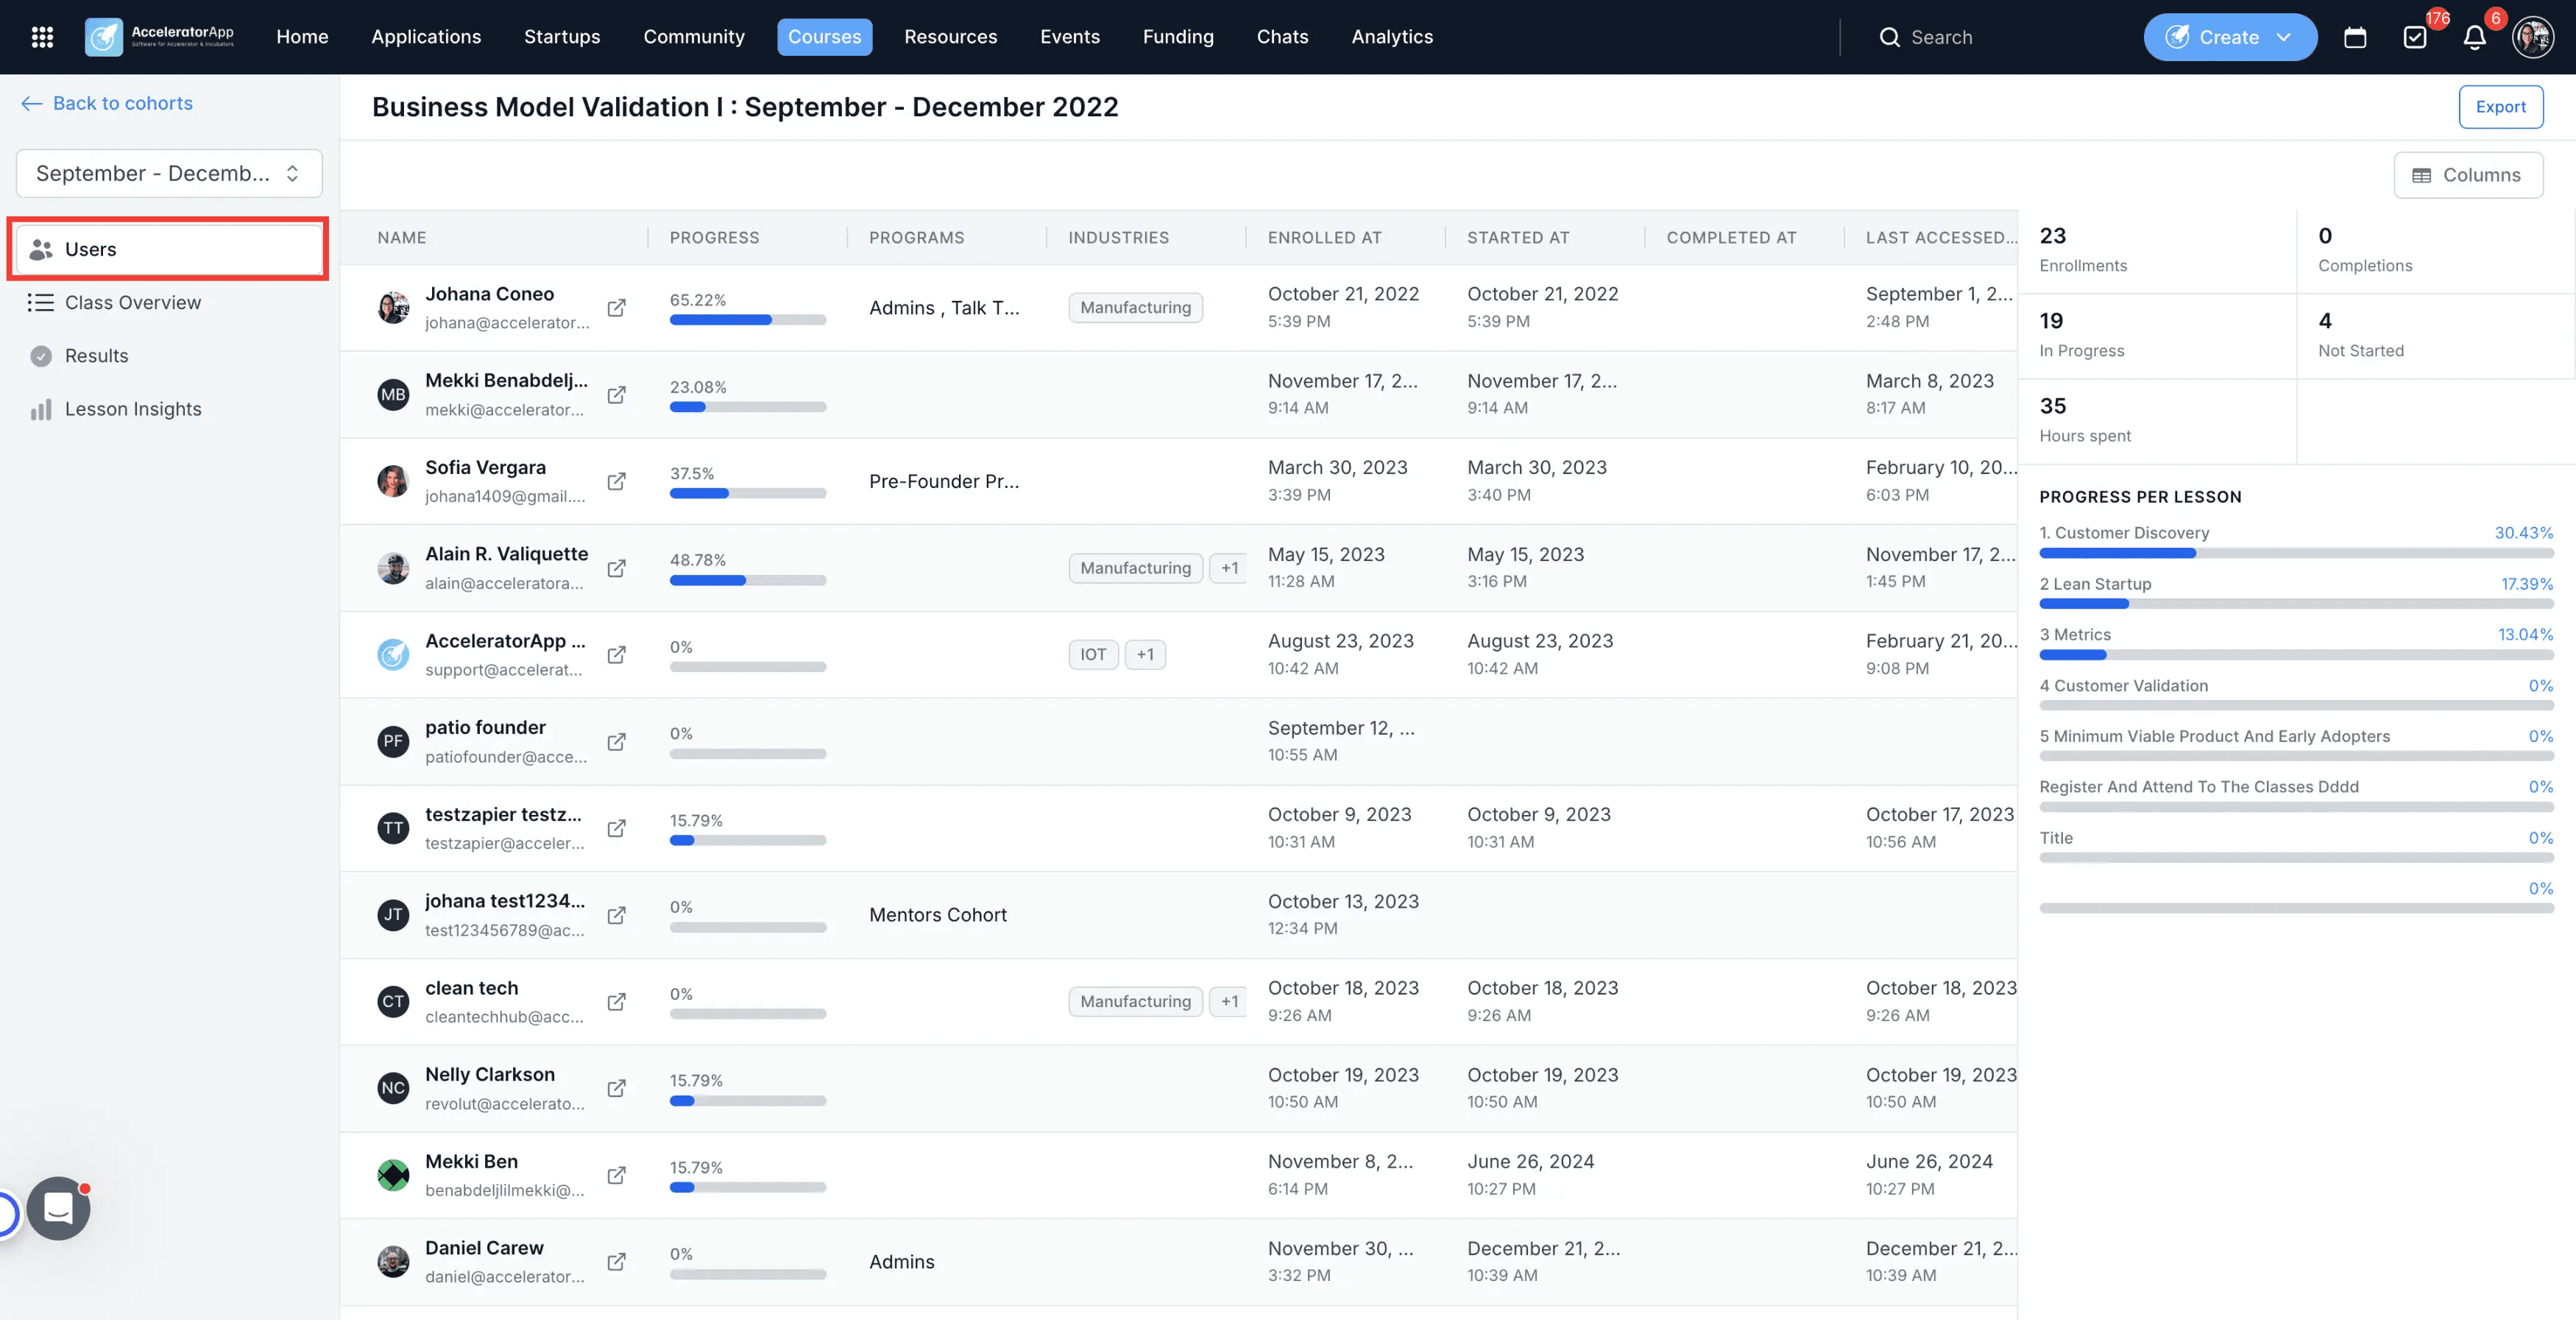
- Users — A table listing each enrolled participant with the following columns: name, progress, programs, tags, industries, and enrollment date. On the right side, a summary panel shows total enrollments, total completions, total in progress, total not started, and total hours spent — along with progress bars broken down by lesson. Clicking on a learner's name opens their individual detail page, where you can see scores, weightage, and final grade for each assignment, quiz, and submission, a full course breakdown showing completion and results per unit, and the option to assign an evaluator to review that learner's assignments.
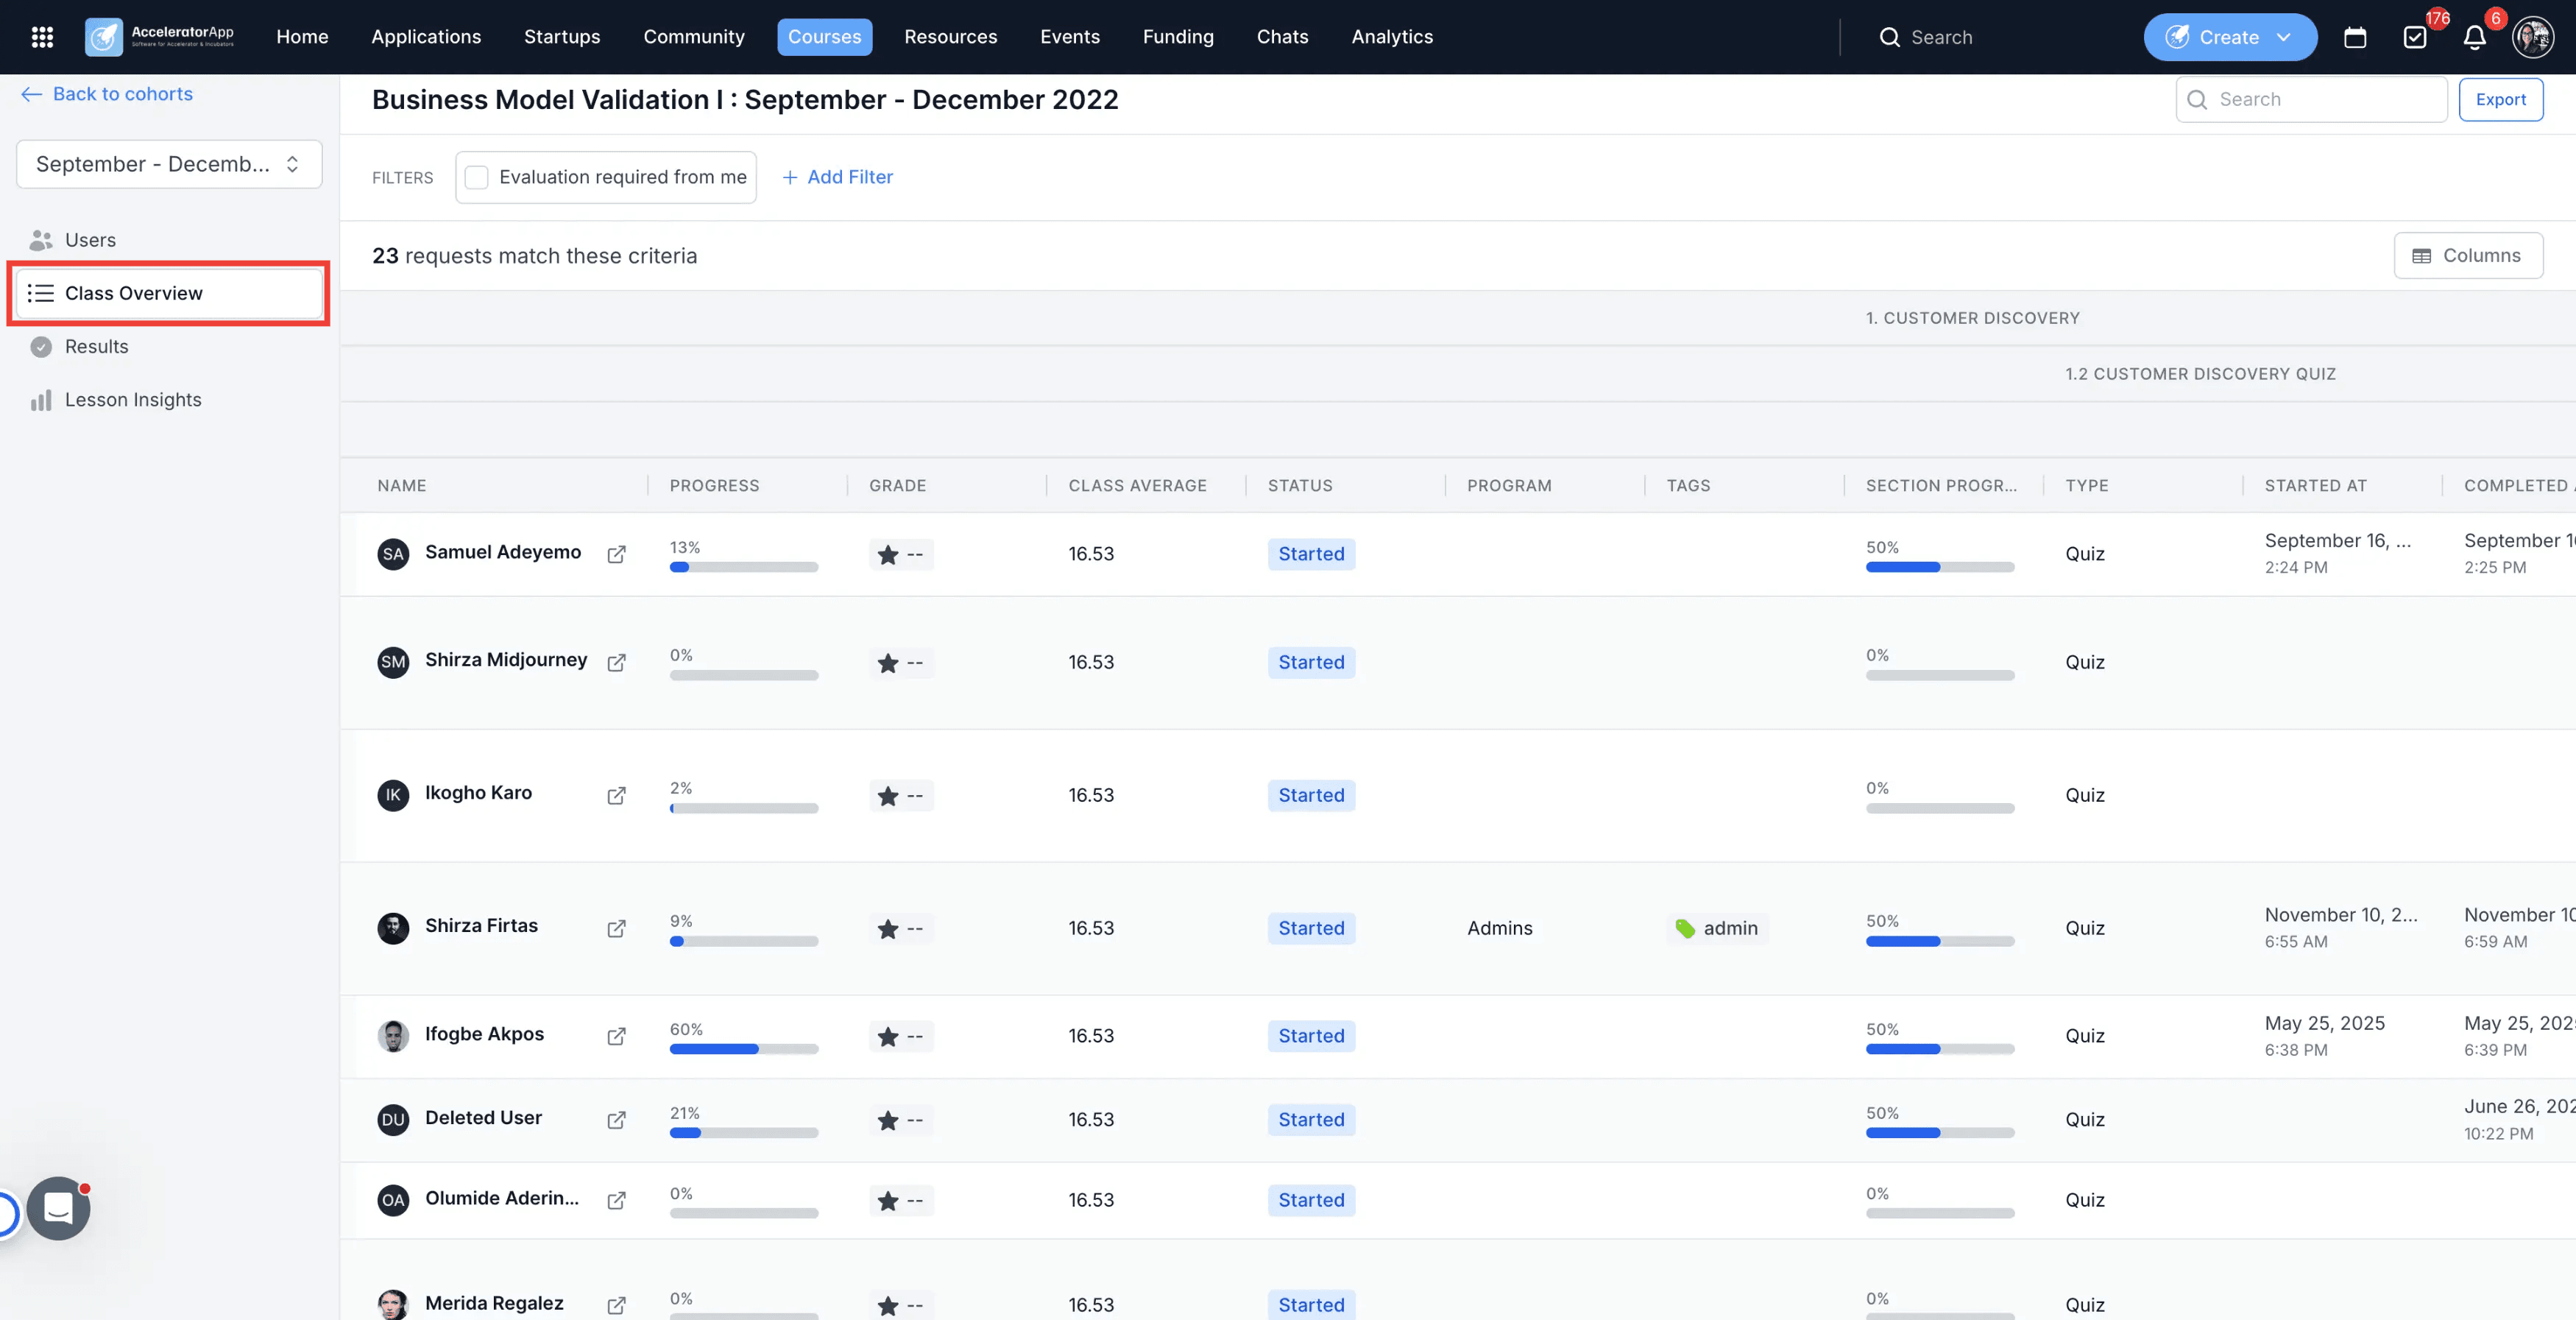
- Class Overview — A detailed table showing all learners and their performance across the course. Available filters include: Evaluation required from me, Todo by evaluators, Evaluation started, and Evaluation submitted. The table includes name, progress, grade, class average, status, program, tags, type (e.g. assignment), started at, completed at, last accessed, time spent, answer, evaluation status (e.g. 0/1 evaluations completed), evaluators assigned, evaluators completed, evaluators pending, quiz scores, and submission responses.
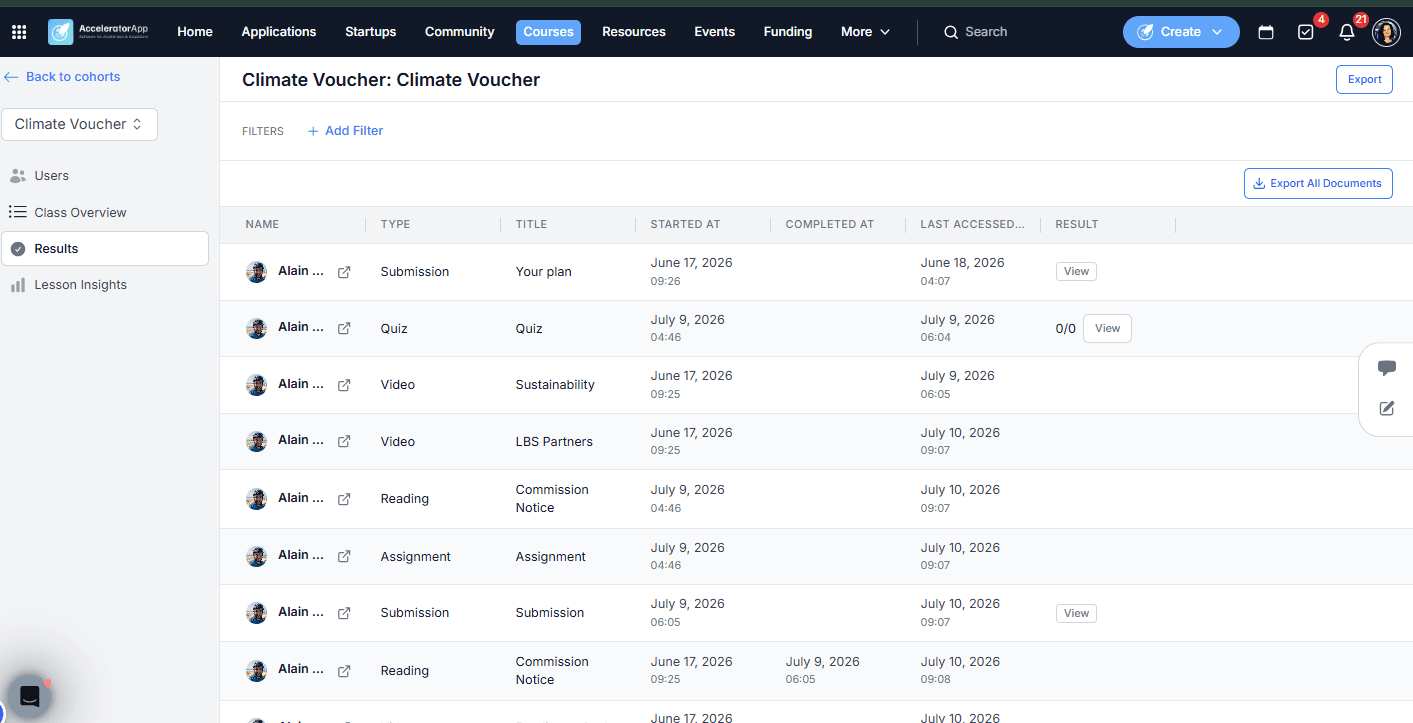
- Results — A unit-level results view with filters for user, section, and unit. The table includes name, type (submission, quiz, etc.), title, start date, completion date, last accessed, and result — with a View button to see the learner's actual response. From this tab you can also export documents uploaded by learners in their submission responses.
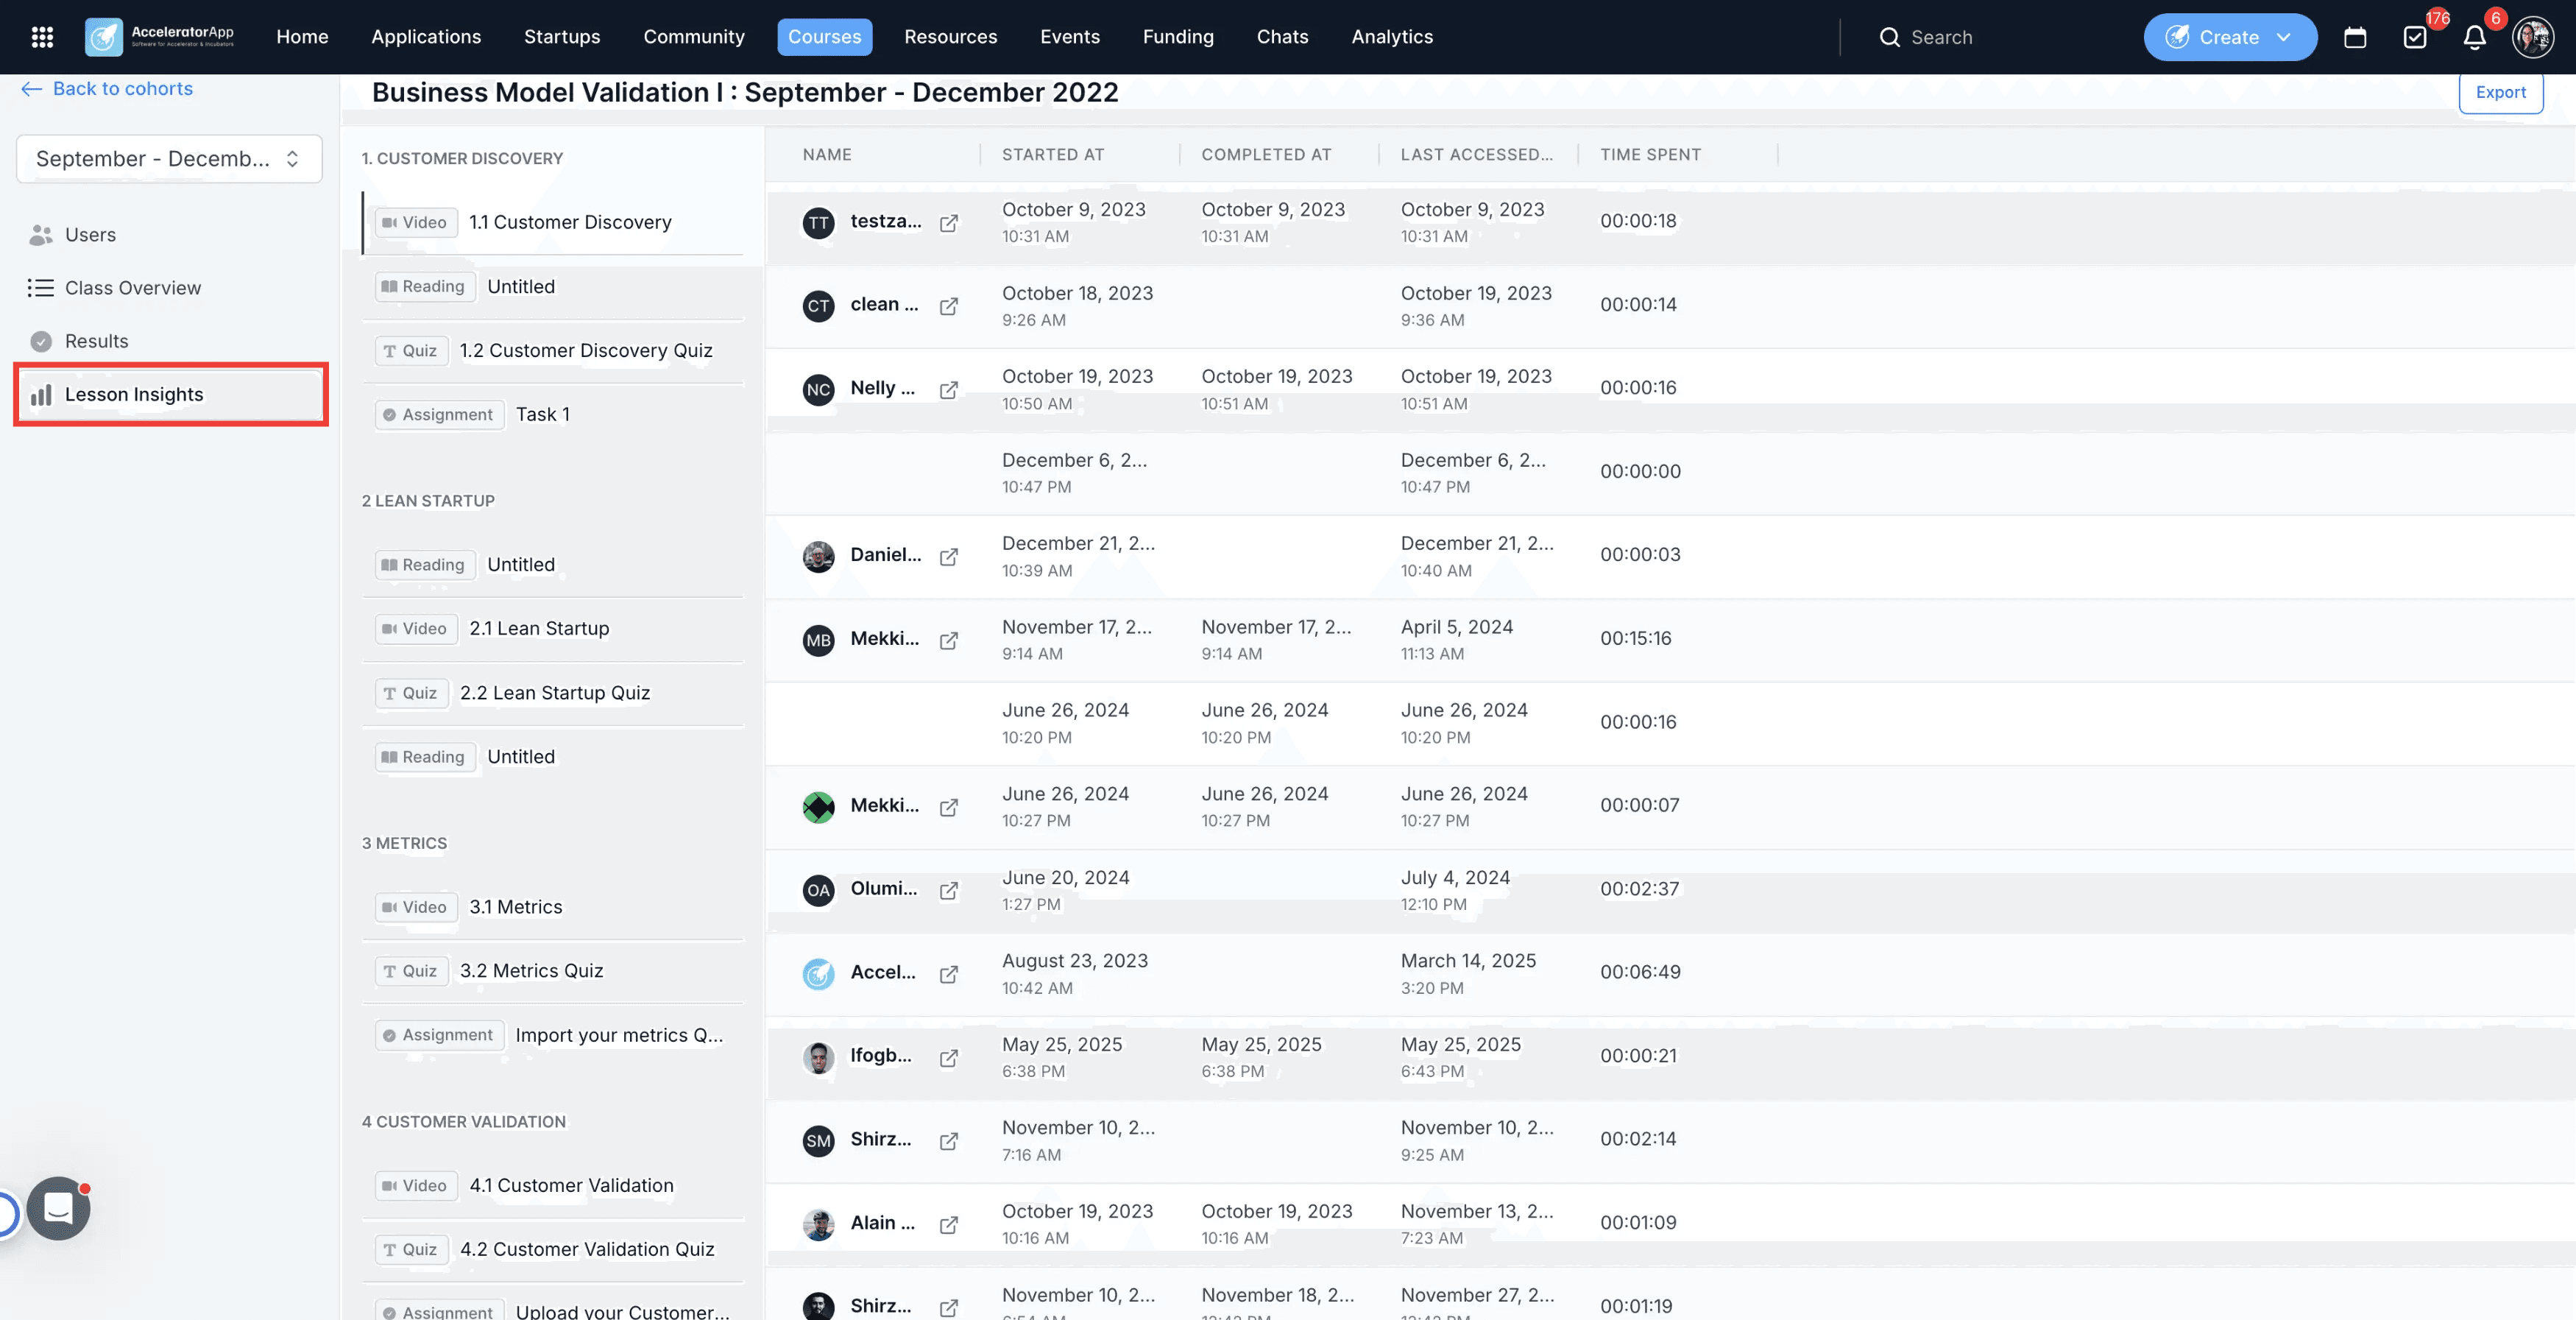
-Lesson Insights — A lesson-by-lesson view of the course. Click on any unit to see a table showing who has started or completed that lesson and how much time they spent on it — useful for identifying which content is driving engagement and which may need attention.
3. Export Data
Every tab includes an Export button. Use it to download the relevant data to an Excel file for external reporting, stakeholder updates, or further analysis.
Best Practices
- Use the Users tab for enrollment and completion overviews. The summary panel on the right gives you a quick health check on each cohort without needing to dig into individual records.
- Use Class Overview to manage evaluations. The evaluation filters (e.g. Evaluation required from me, Todo by evaluators) help you and your team stay on top of pending reviews without manually scanning every learner.
- Use Results to follow up on quiz and submission performance. The View button lets you read individual responses directly — useful for qualitative feedback before assigning a grade.
- Assign evaluators from the learner detail page. Click on a learner's name in the Users tab to access their full record and assign the right evaluator to their assignments.
- Use Lesson Insights to identify content gaps. If many learners are not completing or spending very little time on a specific unit, it may signal that the content needs revision or better context.