Introduction to the Application Dashboard
The Application Dashboard provides a centralized view of all incoming applications.
It helps you track submission trends, monitor funnel performance, and analyze applicant activity over time.
The chart displays the number of applications submitted per funnel, and you can easily compare data between multiple funnels to identify performance patterns or campaign impact.
Various filters are also available to help you visualize specific application segments.
Where can you Access the Application Dashboard?
You can access the dashboard directly from the Applications section of AcceleratorApp:
- From the top navigation bar, click Applications.
- In the left sidebar, click Analytics.
- Select the Dashboard tab at the top of the page.
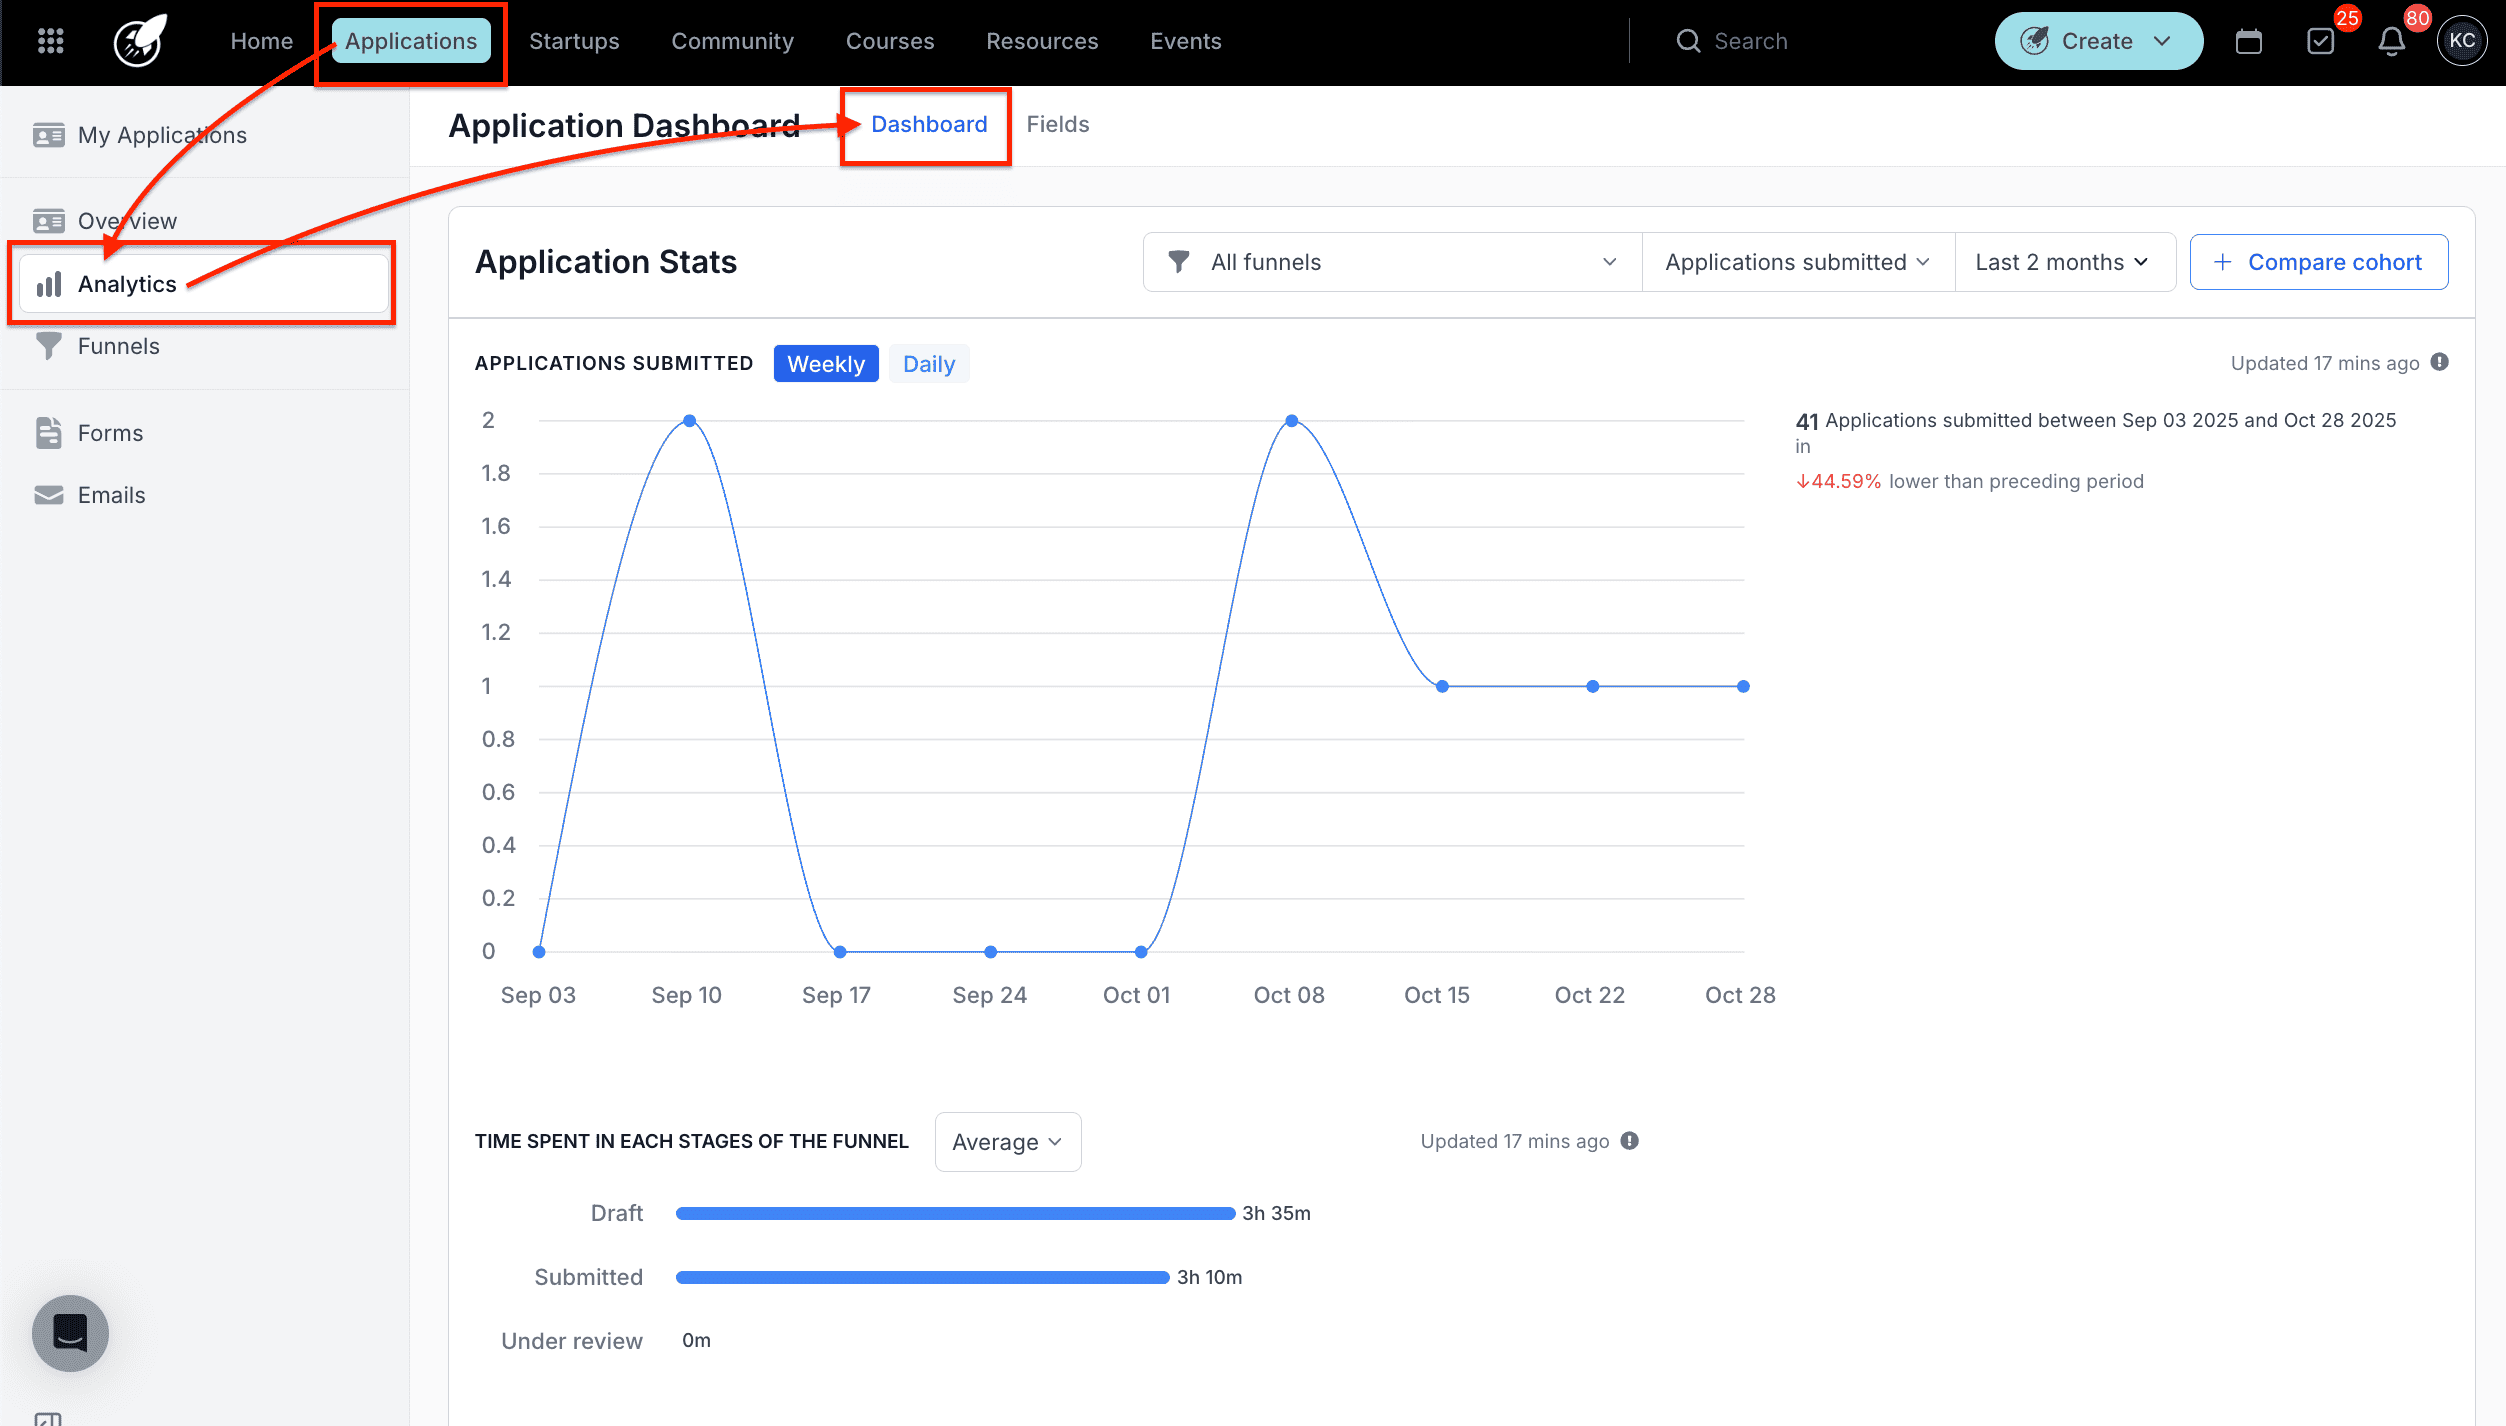
This will open the Application Dashboard, where you can explore data visualizations and apply filters.
Step-by-Step Actions in the Application Dashboard
Viewing and Filtering Data
Once on the dashboard, you can tailor your view using the available filters:
- Funnel Selection: View all funnels or focus on a specific one.
- Application Status: Filter by status — Submitted or Started.
- Date Range: Choose a time period such as Last 7 days, Last 2 months, or Last year to visualize activity over that range.
The chart will update automatically based on your selected filters, allowing you to see trends in application volume and engagement.
Comparing Cohorts
You can compare two funnels side-by-side to evaluate their performance.
To compare cohorts:
- Click Compare Cohort on the right side of the dashboard.
- Select the two application funnels you wish to compare.
- Choose the Application Status (Submitted or Started).
- Set the Date Range.
- Click Apply Filter to view the results.
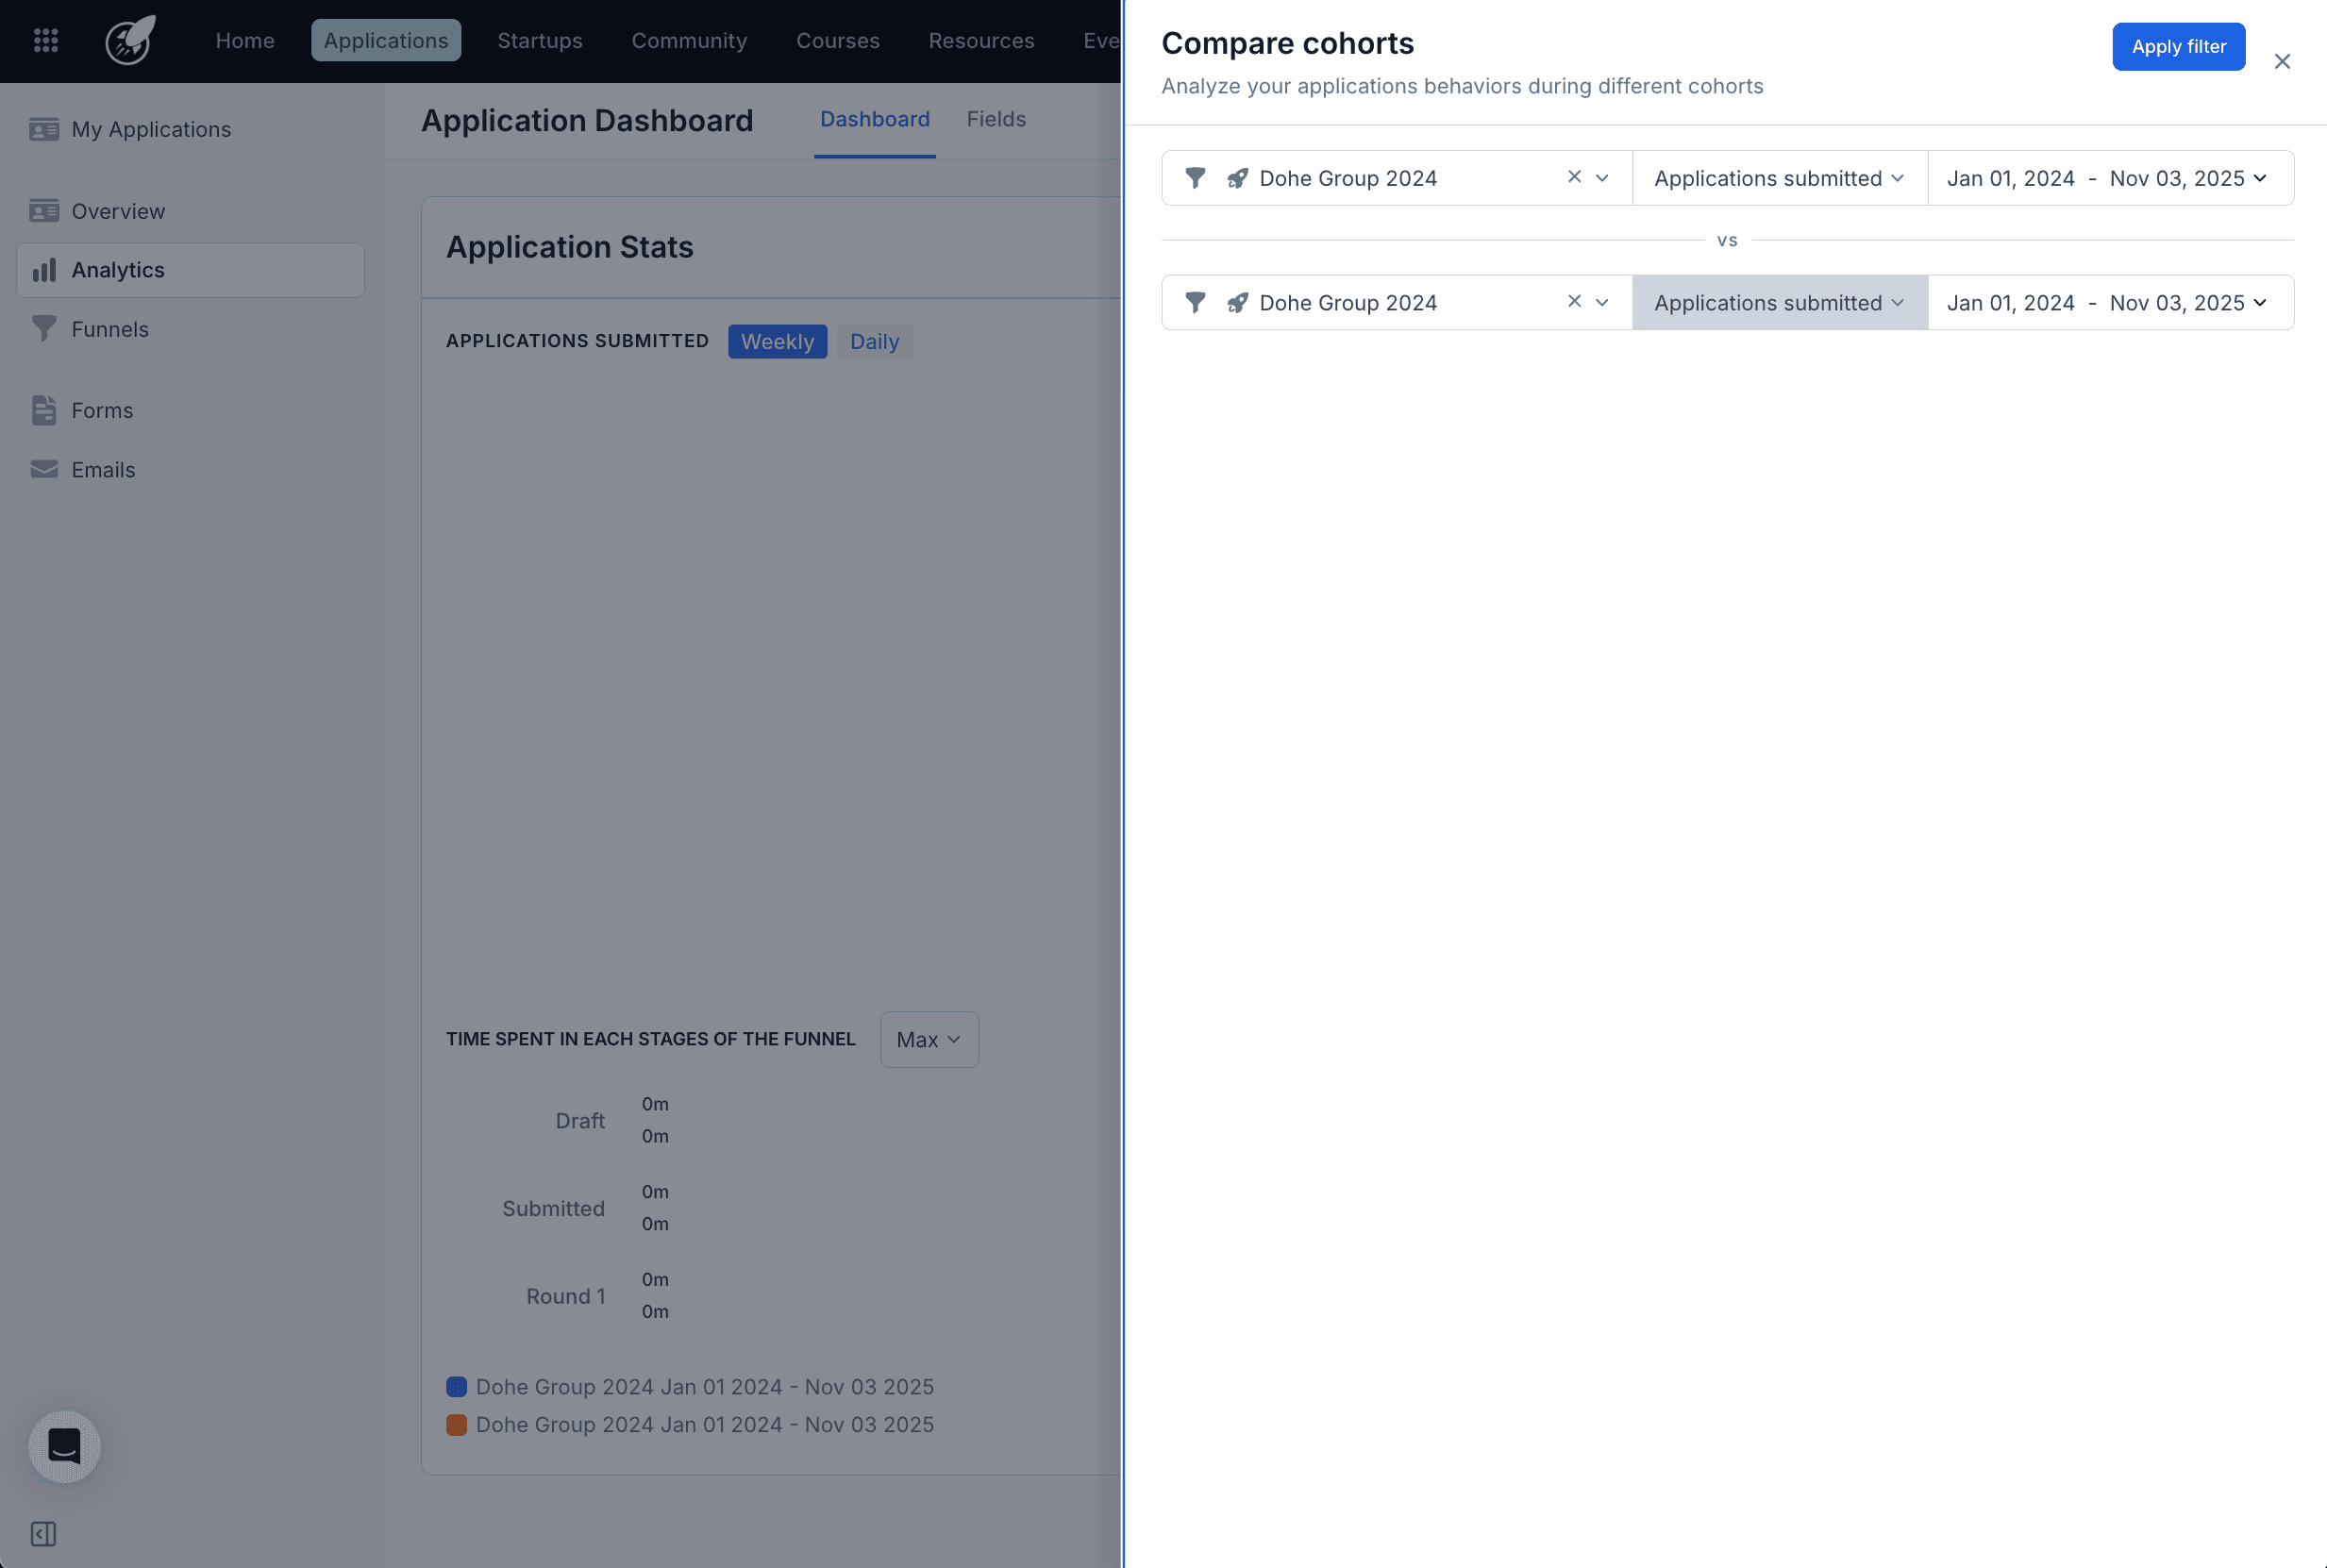
The comparison view helps you identify which funnels attract more applicants, generate faster submissions, or achieve higher engagement rates.
Best Practices
- Use the Weekly/Daily toggle to switch between broader or more granular trends.
- Compare cohorts periodically to assess marketing campaign performance or seasonal variations.
- Regularly monitor average time spent per funnel stage to identify potential bottlenecks in your application process.
- Export and share charts during reporting periods to keep your team informed of funnel progress.