Introduction to Metrics & Data Collection
The Metrics & Data Collection engine is designed to transform progress into quantitative insights. By setting up automated collection cycles, you ensure that startups consistently report their KPIs (Key Performance Indicators) without manual intervention. This data then populates your Analytics Dashboards, allowing you to visualize growth trends, compare program performance, and generate impact reports for stakeholders.
Where to Find Metrics
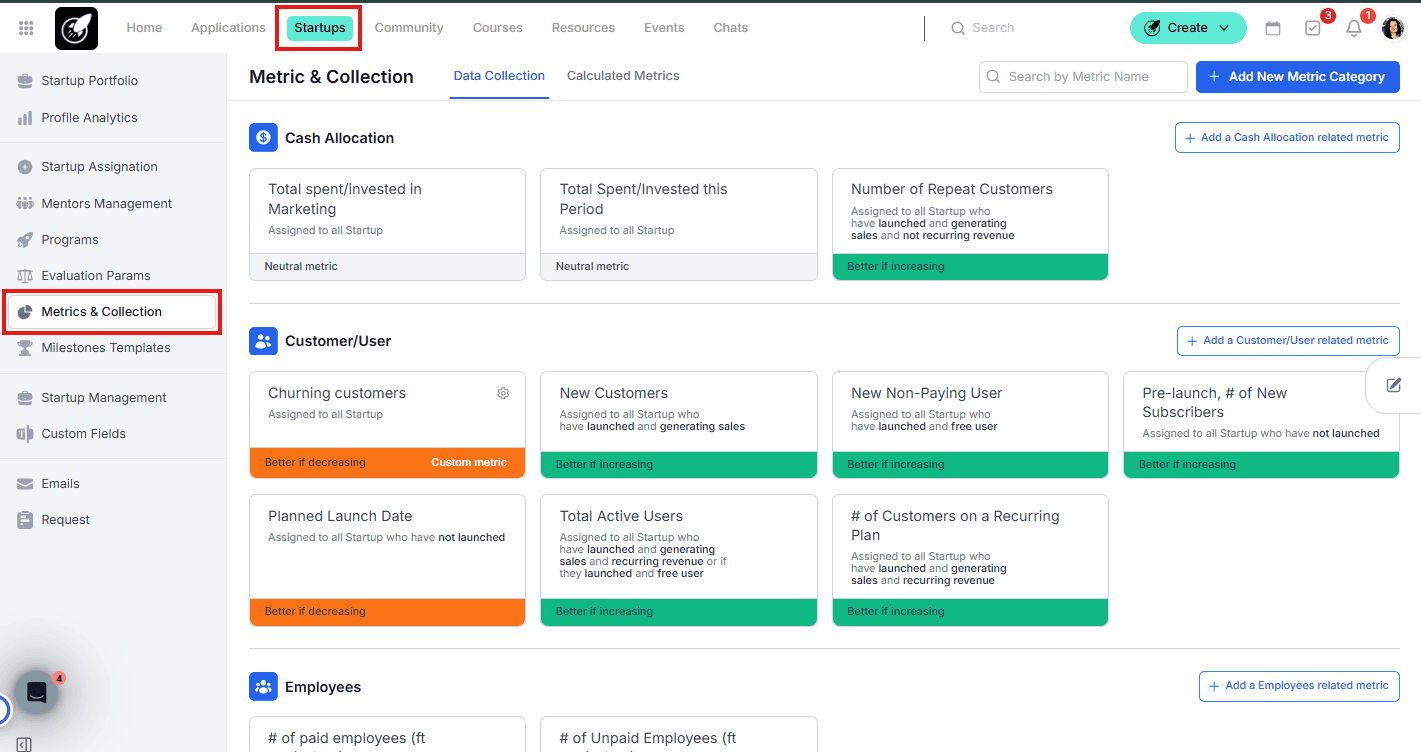
Management & Setup: Go to the Startups tab in the top menu and select Metrics & Collection.
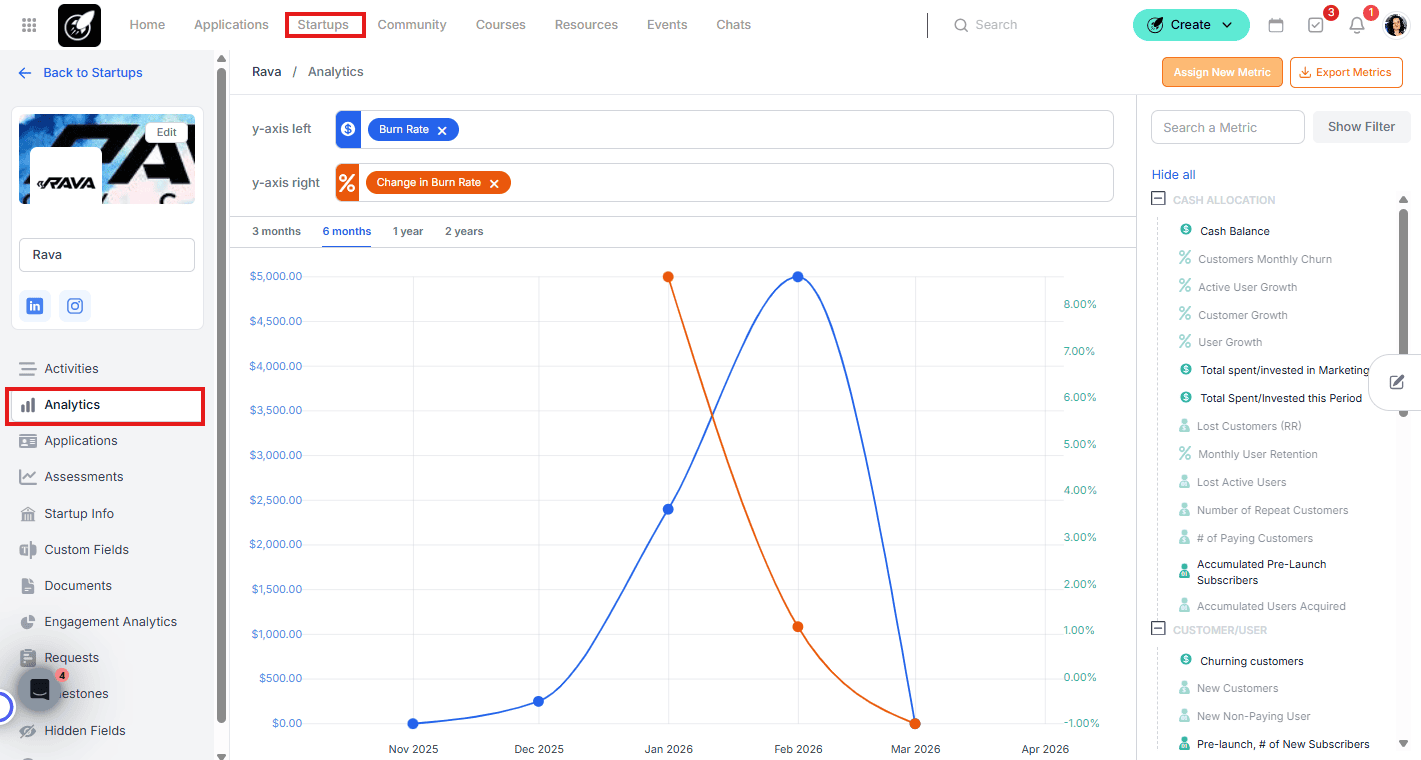
Individual Tracking: Open any Startup File and navigate to the Analytics tab to view specific charts.
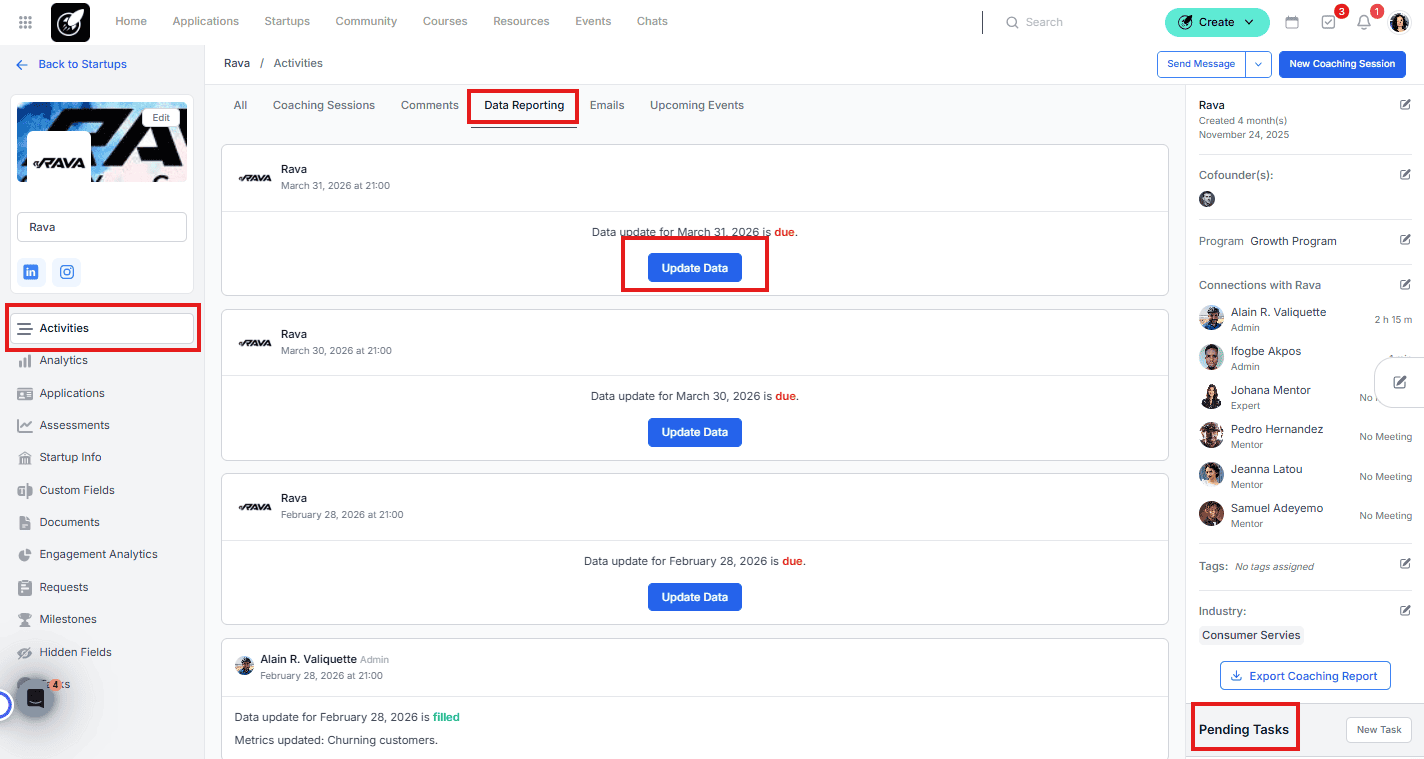
Reporting: Access the Activities Dashboard within a startup file to see pending or completed collection tasks.
Step-by-Step
1. Choosing Your Collection Mode (ask your Customer Succes Manager)
You have two ways to collect data. Note: You cannot use both simultaneously.
Default Platform Metrics: Automated core metrics assigned based on a startup's business model (determined by a monthly 4-question categorization survey) and Calculated Metrics.
Custom Metrics: Allows you to define your own KPIs, frequencies, and units of measure. Enabling this disables the default platform metrics.
2. Creating Custom Metrics
Navigate to Metrics & Collection > Data Collection tab.
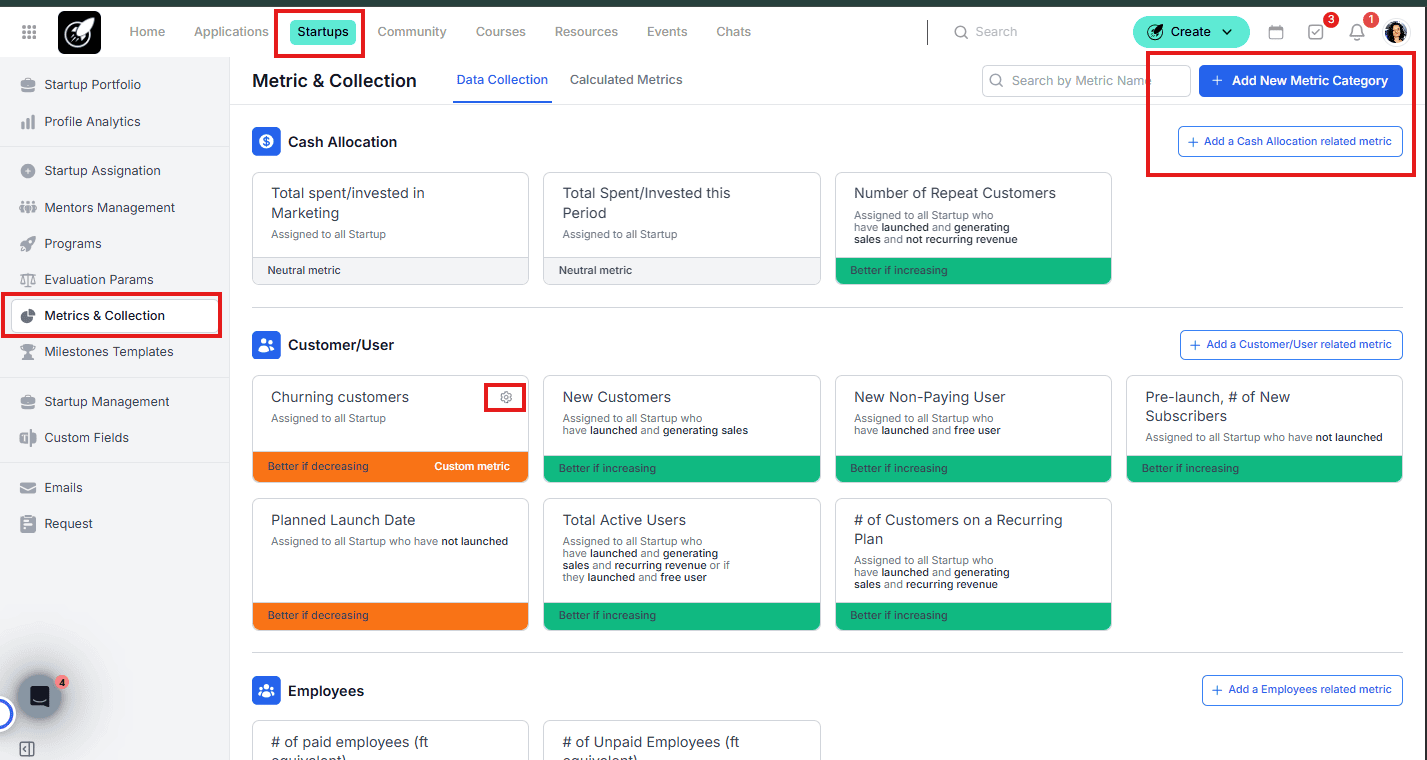
Click Add New Metric Category (e.g., "Financials" or "User Growth").
Click Add Metric and configure the following:
Metric Name & Description: Define exactly what the startup should report.
Recurrence: Set data collection to trigger every X days, weeks, or months.
Unit of Measure: Select from currency, percentages, integers, etc.
First Collection Date: Choose when the first task triggers (can be a past date for historical data).
Toggle "Collecting Data": Switch this ON to start the automation.
Allow Negative Values: Enable if the metric can drop below zero (e.g., Net Profit).
Targeting (Assignation): Choose to assign the metric to All Startups or filter by specific Programs or Startup Tags.
Success Parameters: Select if the metric is better when Increasing, Decreasing, or Neutral.
Save.
Click the gear icon later if you need to edit these settings.
3. The Founder Experience (Data Entry)
Startups are notified via Email, Notification, and Task at the start of every period.
The Persistent Modal: When a founder logs in with pending metrics, a pop-up appears immediately. While they can "Skip" it, the modal will reappear every time they start a new session until the data is submitted.
Access Points: Founders can also update data via:
The link in the Reminder Email.
The Tasks page (completing the task automatically updates the metric).
The Update Data link found in the Startup File under the Activities dashboard.
4. Admin Oversight
As an Admin, you can:
Update on Behalf: Go to the Startup File and enter data for the founder if they provide it via other channels.
Analyze & Export: Visit the Analytics tab in any Startup File to view graphic trends or export the raw data to CSV/Excel.
Best Practices
Clarify Definitions: Use the Description field for every metric. Founders can click the "i" icon next to a metric to see your instructions, reducing errors in reporting (e.g., explaining the difference between Bookings vs. Revenue).
Segment Your Metrics: Don't overwhelm early-stage startups with "Burn Rate" or "LTV" if they haven't launched. Use Program Filters to assign advanced metrics only to later-stage cohorts.
Visualize Before Exporting: Check the Analytics tab frequently. If you see a massive spike or drop that looks like a typo, you can edit the entry on behalf of the startup to keep your aggregate data clean. You can also export data for all your startups from the Startup Portfolio page.